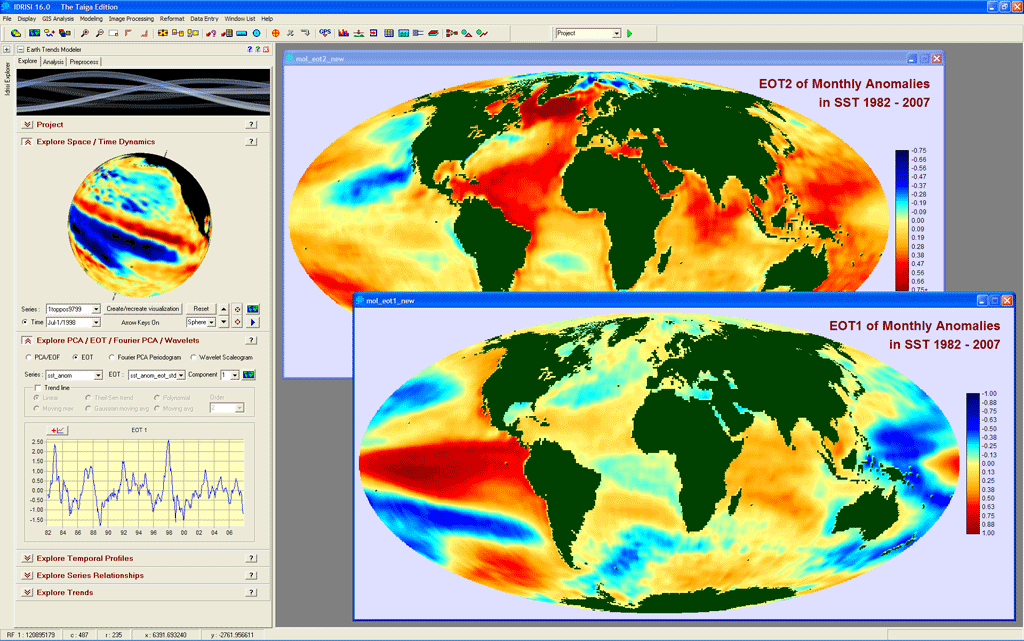
An Empirical Orthogonal Teleconnection (EOT) analysis of monthly anomalies in sea surface temperature (SST) from 1982 to 2007. EOT is a regression-based spectral decomposition technique which is similar in intent and character to an obliquely rotated Principal Components Analysis. Each EOT represents a major pattern of variability over time. The graph shows EOT1 which is clearly the El Niño/Southern Oscillation (ENSO) phenomenon while the foreground image shows what is known as the loading image – the correlation (over time) of each pixel location with this temporal pattern. The background image is the loading image for EOT2 – a combination of the Atlantic Multidecadal Oscillation with a global warming signal.