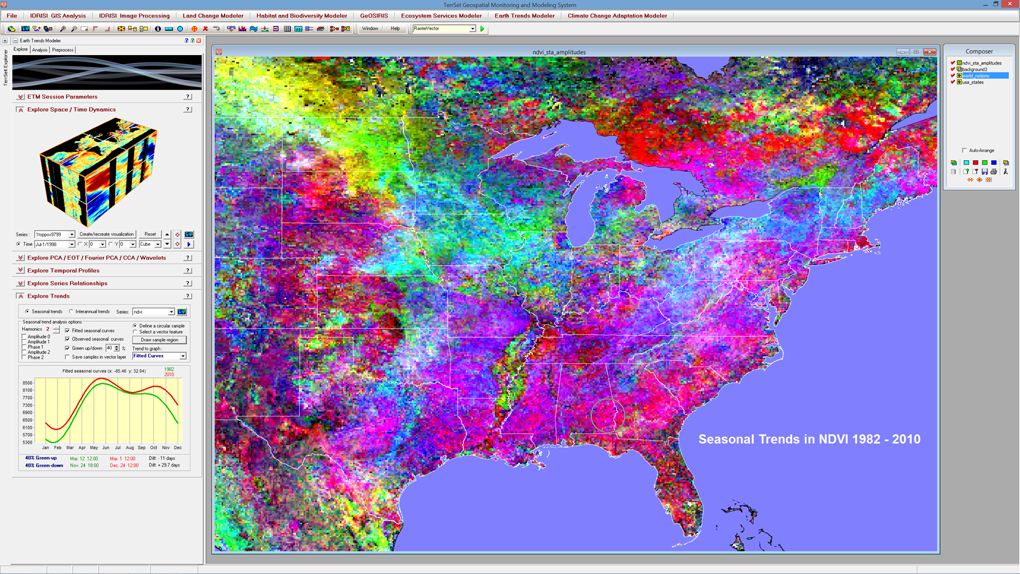
The Earth Trends Modeler (ETM) is specially designed for the analysis of earth observation image time series. In this illustration, a series of 348 global images of monthly NDVI vegetation index data were analyzed for the presence of trends in seasonality. Pixels colored gray (which are almost absent) indicate a stable seasonality. All other colors represent trends. ETM provides an interactive legend (lower left) to interpret the trend for any area (the area in eastern Alabama and western Georgia in this case). The green curve represents the beginning of the series (1982) while the red one represents the end (2010). The X axis is time and the Y axis is NDVI. As can be seen, NDVI has generally increased with a growing bimodality. Spring is coming a bit earlier (11 days) and the autumn is extending longer (almost 30 days).