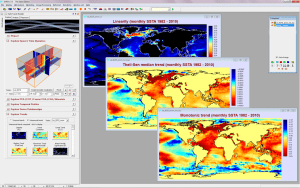
Three of the temporal trend measures provided by ETM. In this case it illustrates an analysis of monthly anomalies in sea surface temperature from 1982 to 2010. The top image expresses the degree to which a linear trend is present. Note that the most linear trends can be found in the north Atlantic sub-polar gyre off of Greenland and at the mouth of the Orinoco river in South America. The middle image is a measure of the rate of change using a special noise-resistant trend measure known as the Theil-Sen median slope. The bottom image expresses trend monotonicity – the degree to which a consistently increasing or decreasing trend can be found (but not necessarily linear).

