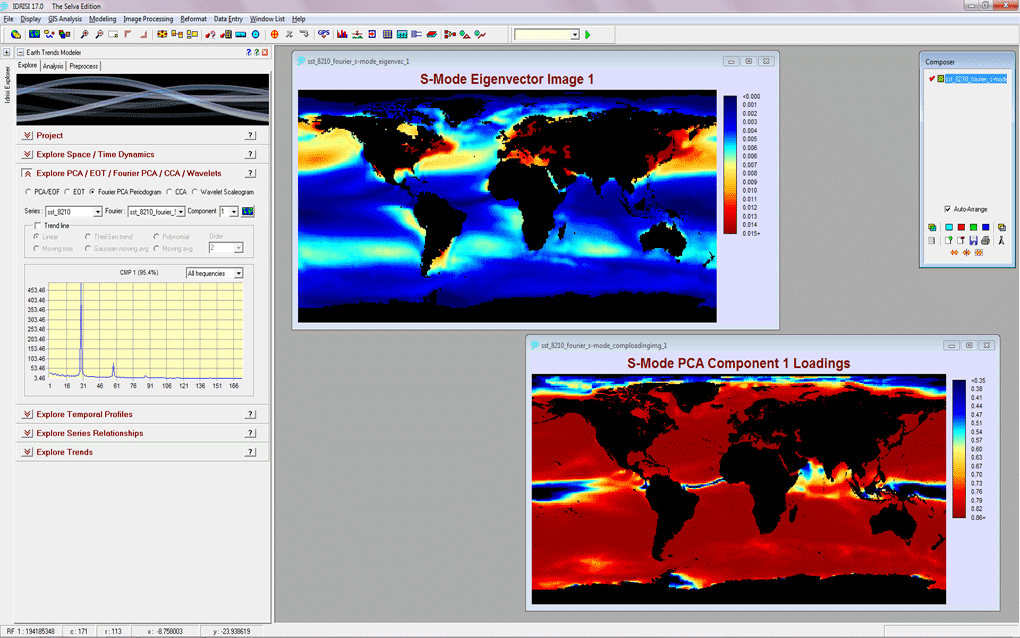
An analysis of monthly sea surface temperature from 1982-2010 using Fourier-PCA. Leading modes of a Fourier-PCA analysis show major patterns of variability that can be described as combinations of sinusoidal waves. The components from this procedure are periodograms with the x-axis representing frequency as wave numbers. This first component shows a strong peak at 29 waves over the 29-year series (with a couple of minor harmonics). It therefore represents the annual cycle. The loading image (lower right) shows that almost all ocean regions (with the exception of the poles and the thermal equator) exhibit prevalent seasonality. However, the eigenvector image shows that the seasonal effect is most extreme in the northern mid-latitudes.